AI reliability starts at the silicon level. Learn how silicon telemetry and GPU performance monitoring help enterprises catch hardware issues before they become costly AI failures.
When an AI model underperforms, most teams look at the data pipeline, the model architecture, or the cloud configuration. What they rarely look at – at least not first – is the chip. That’s a problem, because the hardware layer is increasingly where AI reliability is won or lost.
As AI workloads grow more compute-intensive, AI infrastructure monitoring can’t stop at the software layer. It needs to go all the way down to the silicon – and that’s where chip-level telemetry comes in.
Silicon telemetry refers to the real-time collection of performance signals directly from processors – GPUs, CPUs, TPUs, and other accelerators – while they’re actively running workloads. Think of it as a continuous health feed from the hardware itself: temperature, power draw, clock speed, memory bandwidth, error counts, utilization rates.
This isn’t the same as server-level monitoring. Traditional infrastructure monitoring looks at resource usage from the operating system’s perspective. Silicon telemetry goes a level deeper, pulling signals embedded in the chip’s firmware and hardware performance counters – signals that OS-level tools typically can’t see.
For AI teams running large-scale training jobs or latency-sensitive inference workloads, that depth of visibility is the difference between catching a problem early and waking up to a failed job or degraded model output.
Here’s a scenario that plays out more often than most teams would like to admit: a training run starts behaving oddly – loss curves go flat, throughput dips, or the job finishes with metrics that don’t quite add up. The team debugs for hours. The code is fine. The data is clean. The cluster looks healthy.
What they eventually find – sometimes after days – is that one GPU in the cluster has been silently throttling due to thermal pressure, or a memory module has been producing soft errors that don’t trip any standard alerts.
Without AI hardware monitoring at the silicon level, that failure is invisible until it’s already cost time and compute budget. Processor performance monitoring – done right – surfaces these issues in real time, not in post-mortems.
GPUs are the workhorses of modern AI. Whether it’s training a foundation model or serving inference at scale, GPU performance monitoring is non-negotiable for any team serious about AI infrastructure reliability.
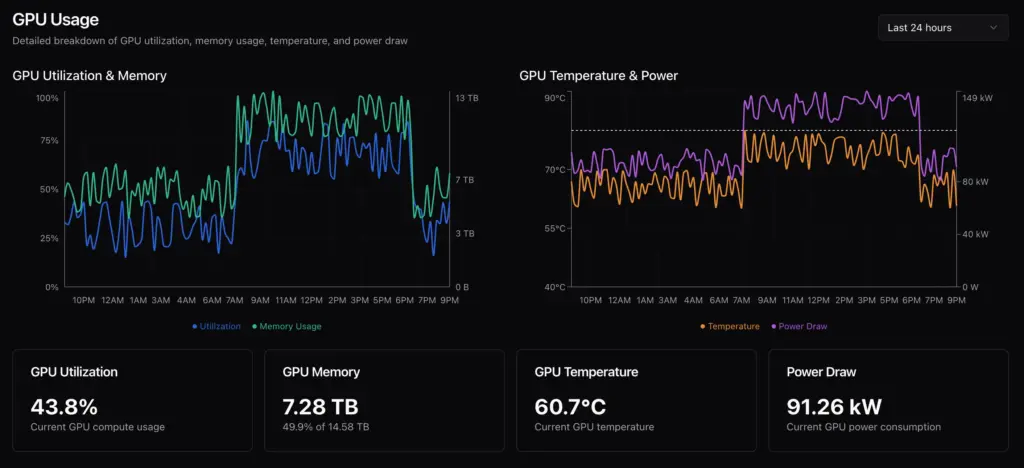
The reason GPUs require special attention is that they operate at the edge of their thermal and power envelopes by design. They’re built to push hard – and when something goes wrong, the failure modes are subtle. A GPU running at 99% utilization looks healthy in a dashboard. A GPU running at 99% utilization with elevated junction temperatures and increasing correctable ECC error rates is a GPU that’s going to fail – or is already degrading your results.
Effective GPU performance monitoring captures that distinction. It tracks not just how busy the chip is, but how stably it’s operating. Metrics like memory bandwidth saturation, SM (streaming multiprocessor) efficiency, PCIe throughput, and power-capping events all tell a story that utilization percentages alone cannot.
AI infrastructure performance monitoring that actually works for modern AI environments needs to operate across several dimensions simultaneously.
Thermal management is the most obvious one – chips that overheat throttle, and throttled chips slow down your workloads. But hardware telemetry for AI infrastructure goes further than that. It includes:
Anomaly detection is particularly critical here. Static thresholds only catch obvious failures. Behavioral baselines – built from each chip’s own historical telemetry – catch the subtle, gradual degradation that causes the hardest-to-diagnose reliability problems.
Collecting AI hardware performance data is only half the job. The operational value of chip-level visibility comes from acting on it.
The most mature implementations tie hardware telemetry into workload orchestration. When a GPU starts showing early warning signals, the scheduler can proactively migrate workloads, rebalance across the cluster, or flag the node for maintenance before a failure disrupts a production run. This is where AI infrastructure monitoring shifts from reactive to predictive.
It also changes how capacity planning works. Teams with granular processor performance monitoring data can correlate chip degradation patterns with workload types, identify which hardware configurations deliver the best efficiency for specific model architectures, and make smarter procurement decisions.
AI infrastructure is expensive. GPU clusters at scale represent millions in capital expenditure, and that’s before accounting for the cost of failed training runs, degraded model quality, or missed SLAs on inference endpoints.
AI hardware monitoring at the silicon level isn’t an operational nicety – it’s a cost-control mechanism. The earlier you catch a hardware issue, the lower the blast radius. And for teams running continuous training pipelines or serving models at high traffic volumes, that early warning capability directly translates to uptime and output quality.
The organizations getting the most out of their AI infrastructure are the ones treating the hardware layer with the same rigor they apply to their models. Chip-level telemetry is how they do it – and as AI workloads grow more demanding, it’s quickly becoming a baseline expectation rather than a differentiator.
Silicon telemetry is the real-time collection and analysis of performance signals – temperature, power, clock frequency, memory error rates, and utilization – sourced directly from processors and accelerators at the hardware level. Unlike OS-level monitoring, it pulls data from the chip’s own firmware and hardware performance counters, giving AI teams granular visibility into how hardware is actually behaving under load.
Chip performance monitoring, often called processor performance monitoring, involves continuously tracking hardware-level metrics from CPUs, GPUs, and other accelerators. It covers everything from thermal behavior and power consumption to memory bandwidth and error rates – providing the signal needed to detect degradation, throttling, and failure risk before they impact workloads.
Monitoring GPU health is critical because these chips operate at the edge of their thermal and power limits during AI training and inference. Problems like thermal throttling, ECC memory errors, and interconnect bottlenecks are often invisible to standard monitoring tools but directly affect AI hardware performance and model output quality. Catching these issues early prevents failed jobs and protects result integrity.
AI infrastructure reliability is directly tied to how stably the underlying hardware performs. A GPU silently throttling due to heat, or a memory module producing soft errors, can corrupt training runs, degrade inference accuracy, or cause silent failures that are difficult to diagnose. AI hardware monitoring at the chip level surfaces these issues in real time, before they escalate into costly outages.
Effective hardware telemetry for AI infrastructure should cover GPU and CPU temperature, correctable and uncorrectable ECC error counts, memory bandwidth utilization, clock frequency behavior including throttle events, PCIe and NVLink throughput, and power draw relative to rated limits. Layering anomaly detection on top of these signals helps identify gradual degradation patterns that static thresholds would otherwise miss.