Learn how B2B organizations leverage telemetry data and big data analytics to drive operational efficiency and boost revenue growth.
Every machine in your operation is screaming data at you. Your production lines, your servers, your customer interactions-they’re all generating streams of information. The problem? Most B2B operations ignore it, delete it, or let it pile up in storage without extracting a single dollar of value.
That’s where big data analytics changes everything. When you treat telemetry data not as noise but as a strategic asset, you unlock insights that drive decisions, reduce waste, and directly impact your bottom line. For enterprises running complex operations, this isn’t optional anymore-it’s competitive necessity.
Here’s what we’re talking about: real-time visibility into what’s actually happening across your business, not what you think is happening. That difference translates to faster problem-solving, smarter resource allocation, and revenue growth that compounds.
Telemetry data is simply information automatically collected from your systems and assets. A sensor reading equipment temperature. Your CRM logging customer engagement. A cloud service recording API response times. Manufacturing equipment sending performance metrics. All of it is telemetry.
The catch? Raw telemetry data without context is just noise. You could have billions of data points and still make terrible decisions if you’re not analyzing them properly. That’s where big data analytics enters the picture.
Big data analytics takes these massive, messy datasets and transforms them into patterns, trends, and actionable intelligence. It’s the difference between knowing your factory generated 5 million data points yesterday and knowing exactly which production line is trending toward a failure, or which operational inefficiency is costing you $10,000 per day.
For B2B analytics, this matters because operations are complex. You’re juggling supply chains, production schedules, customer deliverables, and resource constraints simultaneously. Each variable generates telemetry data. When you can see all those variables together through big data analytics, you start making decisions with actual clarity.
Let’s get specific about what operational analytics actually does for your business.
Operational analytics is the continuous monitoring and analysis of how your business processes actually perform. Unlike historical reporting (which tells you what happened last quarter), operational analytics shows you what’s happening right now, and what’s likely to happen next.
Imagine running a manufacturing operation with 200 machines. Traditionally, you’d schedule maintenance on a calendar-every three months, you service each machine whether it needs it or not. You’re doing preventive maintenance blind. Meanwhile, machines are failing on week six.
With operational analytics, you’re monitoring each machine’s health in real-time. You see patterns. You know exactly when failure risk spikes. You schedule maintenance when it’s actually needed, not before or after. You eliminate emergency downtime, extend equipment life, and reduce maintenance costs-sometimes by 20–30% depending on the operation.
That’s just one example. The same logic applies to supply chain visibility, customer churn prediction, quality control, staffing optimization, and dozens of other operational levers.
Business intelligence and data visualization tools make this visible. A good dashboard shows you the metrics that matter, instantly. You’re not digging through spreadsheets or waiting for reports. You see the problem, you understand it, and you respond.
Here’s where this gets interesting for your P&L: telemetry data isn’t just about cost reduction. It directly generates revenue growth when you know how to use it.
Consider demand forecasting. With big data analytics applied to customer behavior patterns, transaction history, and market signals, you can predict demand weeks or months ahead of traditional forecasting. That means you’re stocking inventory based on reality, not guesswork. You reduce stock-outs (lost sales) and overstocking (dead capital tied up in products). For an enterprise moving millions in product, that’s material impact.
Or consider customer lifetime value prediction. Your B2B analytics platform analyzes every customer touchpoint-purchase history, support interactions, contract terms, engagement metrics. You quickly identify which customers are most likely to expand, which might churn, and which are already maximizing their potential with you. Your sales team focuses on the expansion opportunities. Your retention team focuses on at-risk accounts. You’re not spray-and-pray anymore; you’re precision-targeted. Revenue compounds.
Consider pricing optimization. Operational analytics combined with market data reveals price elasticity-what margin you can capture while maintaining volume. You’re not leaving money on the table by underpricing, and you’re not losing deals by overpricing. Every contract negotiation becomes data-informed.
The pattern here: telemetry data feeds into smarter operations, which feed into smarter go-to-market decisions, which feed into revenue growth. It’s not mystical. It’s mechanical. You improve visibility, you improve decisions, you improve outcomes.
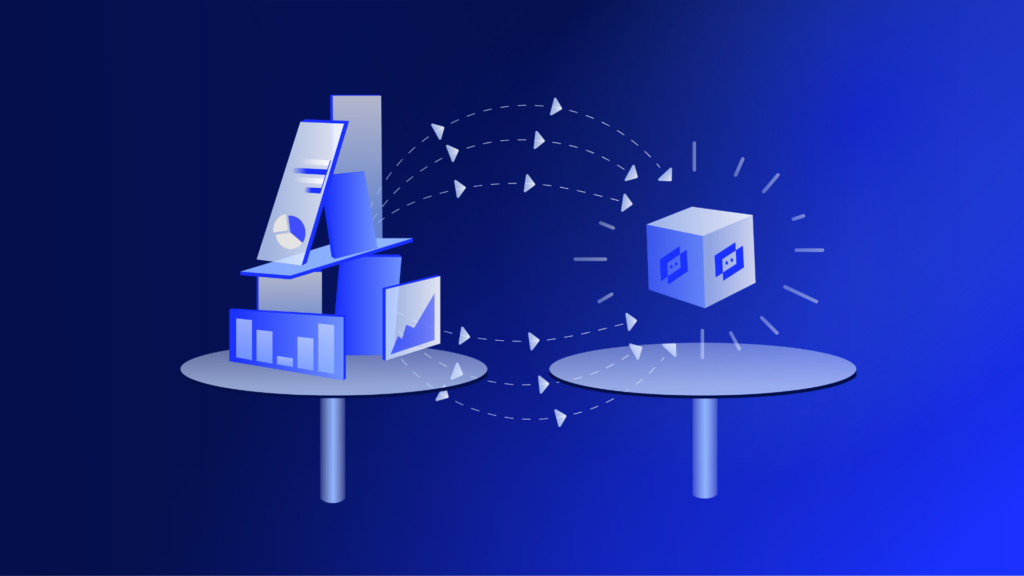
To do this at scale, you need infrastructure. A data lake-a centralized repository where you dump all your telemetry data from disparate sources-becomes your foundation.
Don’t confuse a data lake with a data warehouse. A warehouse is structured, organized, optimized for specific queries. A data lake is flexible-you dump raw data in from everything, and you figure out later what’s valuable. This matters because your most interesting insights often come from unexpected correlations. You don’t want to throw away data just because you didn’t anticipate the question.
Your data lake aggregates telemetry data from:
Once centralized, you apply business intelligence tools and data visualization platforms on top. That’s where the intelligence emerges.
The investment here isn’t trivial, but it compounds. Your first analysis might take weeks. Your tenth analysis takes days. Your hundredth analysis takes hours. You’re building institutional knowledge and analytical capacity.
Static reporting is dead for serious B2B analytics. You need real-time visibility.
Real-time operational analytics means you see problems within minutes, not days. A quality issue on your production line isn’t discovered after 1,000 defective units ship; it’s caught after 50. A customer support backlog isn’t discovered in the monthly report; it’s visible on your dashboard as it’s happening, and you’re already reallocating resources.
For B2B operations with tight margins and SLA commitments, real-time visibility is the difference between meeting commitments and breaching them. It’s the difference between proactive decision-making and reactive fire-fighting.
Modern big data analytics platforms (cloud-based, mostly) make real-time analysis feasible without massive infrastructure investment. You’re not running analytics on your laptop. You’re spinning up scalable compute resources that crunch terabytes of telemetry data and return insights in seconds.
Here’s the hard part: technology is only half the battle. The other half is organizational. You need analysts who can ask good questions, stakeholders who trust the data, and leadership committed to acting on insights even when they contradict previous assumptions.
Teams that excel at operational analytics share a few traits:
Build that culture, layer in the technology, and you’ve got a competitive moat.
Telemetry data is abundant. Big data analytics is now accessible to enterprises of all sizes. The question isn’t whether you can do this-it’s whether you will, and how quickly.
Your competitors are already turning telemetry data into operational intelligence. They’re optimizing costs, improving quality, predicting customer behavior, and capturing revenue you’re leaving on the table. The gap widens every quarter.
Start small if you need to. Pick one operational problem you want to solve-maybe inventory optimization or churn prediction. Build your data lake incrementally. Prove ROI on that first analysis. Then scale.
The businesses winning today aren’t the ones with the most data. They’re the ones extracting the most value from it. That requires big data analytics, real-time operational analytics, and a culture that treats data as a strategic asset.
That’s not a technology problem anymore. It’s a business problem. And the businesses that solve it first capture disproportionate advantage.
Telemetry data is information automatically collected and transmitted from your systems, machines, applications, and services. Examples include equipment sensor readings, software performance metrics, customer interaction logs, API response times, and IoT device outputs. In B2B operations, telemetry data streams from manufacturing equipment, cloud infrastructure, enterprise software, and connected devices. Raw telemetry data is abundant but unstructured; big data analytics transforms it into actionable intelligence. For organizations managing complex operations, telemetry data is the foundation of modern decision-making.
Big data analytics reveals operational patterns that would be invisible in traditional reporting. It enables predictive maintenance (spotting equipment failures before they happen), demand forecasting (optimizing inventory), process optimization (identifying bottlenecks), quality control (catching defects faster), and resource allocation (matching supply to actual need). By analyzing telemetry data from across your operation simultaneously, big data analytics surfaces correlations and trends that drive smarter, faster decisions. The result is lower costs, fewer surprises, and better execution against commitments.
Operational analytics is the continuous, real-time analysis of how your business processes actually perform. Unlike historical reporting, which shows you what happened last month, operational analytics shows you what’s happening now and what’s likely to happen next. It combines telemetry data from your systems with data visualization and business intelligence tools to create dashboards and alerts that keep your team informed. Operational analytics enables proactive decision-making rather than reactive firefighting.
Telemetry data increases revenue through multiple mechanisms: better demand forecasting reduces stock-outs (lost sales) and overstocking (wasted capital), customer analytics identifies high-value expansion opportunities, price optimization maximizes margins while maintaining volume, and churn prediction enables targeted retention before customers leave. By analyzing telemetry data with big data analytics and business intelligence, you’re essentially making every operational and commercial decision based on reality rather than assumption. Reality-based decisions compound into measurable revenue growth.
Predictive analytics uses historical telemetry data to forecast future outcomes-equipment failures, customer churn, demand spikes, quality issues, and more. Benefits include preventing costly downtime through predictive maintenance, retaining customers before they leave, optimizing inventory for anticipated demand, and allocating resources proactively. For B2B operations, predictive analytics transforms problems from reactive (responding after failure) to preventive (acting before problems occur). This reduces costs, improves reliability, and directly strengthens customer relationships by ensuring consistent delivery.